Mirror Analysis Methodology
This project supplies trade misinvoicing data to GFI’s national and global IFFs reports. Powered by cloud computing, GFI’s trade misinvoicing analysis utilizes global trade data at the 6-digit HS code level for each pair of countries over the past 16 years in an efficient and robust manner. Averaging 15 million transactions per year, the Comtrade database of the United Nations is our main source of data. Data from various other sources is incorporated into our analysis to address re-exportation and reporting differences. For national reports, we also estimate tariff loss.
Special thanks to Matthew Salomon and Joseph Spanjers for laying the groundwork.
Download our source code explainer here.
View our source code on GitHub here.
Related reports:
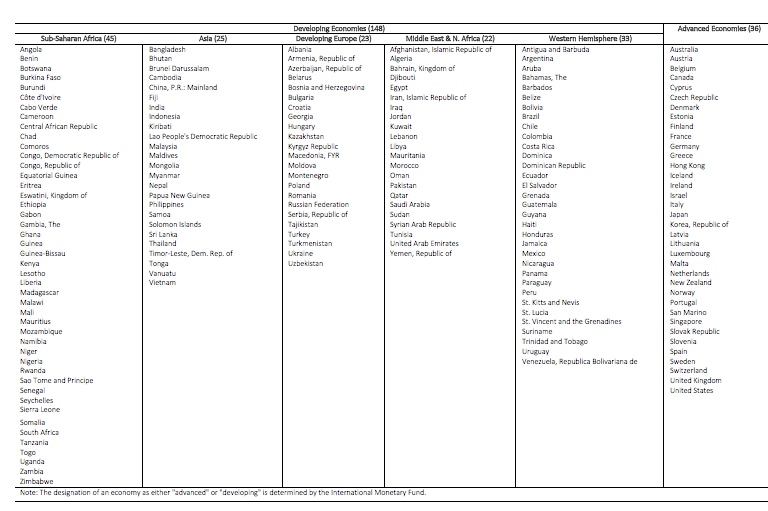
Illicit Financial Flows to and from 148 Developing Countries: 2006-2015
Egypt: Potential Revenue Losses Associated with Trade Misinvoicing
Indonesia: Potential Revenue Losses Associated with Trade Misinvoicing
India: Potential Revenue Losses Associated with Trade Misinvoicing
South Africa: Potential Revenue Losses Associated with Trade Misinvoicing
Nigeria: Potential Revenue Losses Associated with Trade Misinvoicing
Kenya: Potential Revenue Losses Associated with Trade Misinvoicing
General Process
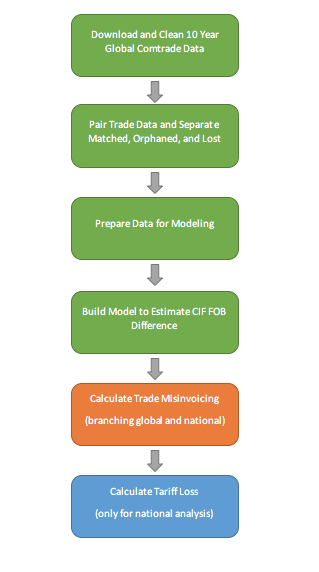
(Refer to the master flow chart for the detailed process from a technical aspect.)
Step 1: Downloading and Cleaning 16 Year Global Comtrade Data
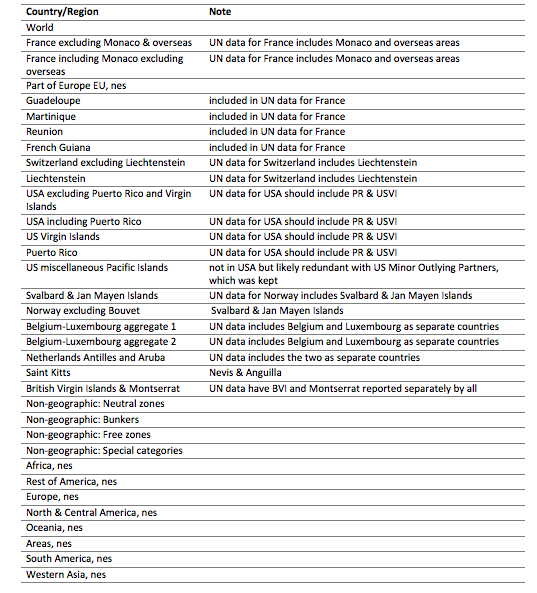
GFI used the bulk API of UN Comtrade database to download global trade data year-by-year to ensure that every necessary transaction was covered. Only transactions of 6-digit level HS code were included in our analysis. The following countries/regions were removed to prevent double counting.
Swiss foreign trade in gold, silver and coins was added for 2001 to 2011 (Source: Swiss Customs Administration). Trade for Slovakia and Montenegro was adjusted (please refer to the Brief of Methodology section for details on how).
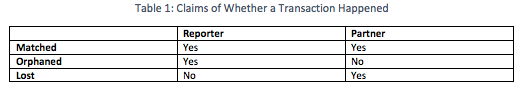
Step 2: Pairing Trade Data and Separating Matched, Orphaned, and Lost
This step paired reporter countries and their partner countries record-by-record (the other 2 pairing criteria are same year and same 6-digit commodity code). Hong Kong re-exports were adjusted after pairing. From paired data, GFI separated matched, orphaned, and lost transactions by the following claims for each transaction from its reporter and its partner. For a full description of what these records are and why we eliminate them from consideration in our value gap analyses, please see GFI’s Value Gap Analysis Methodology.
Step 3: Preparing Data for Modeling
Data used from this step onward is a subset of the annual UN Comtrade data, where our preliminary requirements hold.
Preliminary Requirements:
(1) Non-zero values for the transaction are reported by both the reporting country and its partner;
(2) Non-zero volumes for the transaction are reported by both the reporting country and its partner;
(3) Volumes are reported in the same physical units for both the reporting country and its partner.
GFI added regional trade agreement type, geographical information (from CEPII) and development level data to the subset and removed all incomplete records. Only records of bilateral trades that comply with all three of these features are used in our value gap analyses. If records do not comply with all three features, then we categorize these records as “others” and eliminate them from consideration.
Step 4: Building Model to Estimate CIF-FOB Difference
Another factor in price differences is seen when exporters and importers report a different price for the same good, as importers report the actual cost of the good, as well as additional costs for shipping and related transport insurance, known as the cost, insurance and freight (CIF) price, whereas the exporter reports a lower freight-on-board (FOB) price. Therefore, some countries report import values to Comtrade on a CIF basis only, while others report on an FOB basis.
For a full description of the difference between CIF and FOB prices and why it is important to our value gap analysis, please see GFI’s Value Gap Analysis Methodology.
A regression model (refer to FOB equivalents for details) was built from a subset that satisfied the following criteria: (1) the mirror trade volumes differed by more than 2.5 percent and (2) the ratio of the (implied) unit values of imports to exports was greater than 1.8, or less than 0.8.
Step 5: Calculating Trade Misinvoicing
The difference between reporters’ reporting value and their partners’ reporting value on FOB (Free On Board) bases is the gross value of trade misinvoicing. The gross value of trade misinvoicing was then weighted by a weighting scheme detailed in the weighted trade gaps section.
Advanced economies were used as a benchmark against which potential trade misinvoicing is estimated. Not every developing country reported bilateral trade with advanced economies in every year published in the Comtrade database.
Step 6: Calculating Tariff Loss
For reports on single countries, GFI used the World Bank WITS database for tariff rates, which were based on weighted effectively applied tariff rates in TRAINS (Trade Analysis Information System by UNCTAD) and WTO-IDB. In case of duplication, TRAINS data was used.
Tariff rates were then applied to weighted values of trade misinvoicing at 6-digit HS code level for every partner country to calculate tariff loss.
Data Sources
UN Comtrade
Illicit financial flows were estimated from a subset of annual UN Comtrade data where our preliminary requirements hold. The time span is 10 years and only countries listed in Appendix 1 were included.
Census and Statistics Department of the Government of Hong Kong Special Administrative Region
Hong Kong re-export data for adjusting effect of re-export passing Hong Kong in UN Comtrade database.
NSF-Kellogg Institute for International Studies Data Base on Economic Integration Agreements (April 2017)
Data of varying types of regional trade agreement between countries from 1950 to 2012. GFI used 2012 data for every subsequent year. Certain types of regional trade agreements were used in a regression model to estimate gaps between CIF and FOB reporting, in other words, the cost of transportation and insurance.
Centre d’Études Prospectives et d’Informations Internationales (CEPII)
Geographical information used in the regression model to estimate gaps between CIF and FOB reporting.
Swiss Customs Administration
Swiss foreign trade in gold, silver and coins by trading partner, 1982-2013
World Bank WITS (only for national reports).
Tariff rates were based on weighted effectively applied tariff rates in TRAINS and WTO-IDB. In case of duplication, TRAINS data was used.
Brief of Methodology
Preliminary Data Treatments:
Non-reporting of Swiss trade flows of precious metals in Comtrade for years prior to 2012
GFI added trade data in gold, nonmonetary, unwrought others (other than powder) from Swiss Customs Administration for 2001 to 2011.
Re-export trade through Hong Kong
GFI followed OECD’s practice in BALANCE INTERNATIONAL MERCHANDISE TRADE DATA: VERSION 1.
Serbia and Montenegro
Beginning in 2006, adjust Serbia reports to reflect an independent Montenegro from Serbia-Montenegro.
FOB Equivalents:
For those countries that report import values to the United Nations on a CIF basis only, FOB equivalents are calculated using margins predicted by a regression model that utilizes geographical information, regional trade agreements, infrastructure quality (proxied by level of development based on IMF), global median price (based on reported export prices at 6-digit level), commodity classification methods and year of trade. The training set was a subset of 2001-2016 Comtrade data after undergoing a series of preliminary treatments, filtered by our preliminary requirements and satisfied the following criteria: (1) the mirror trade volumes differed by more than 2.5 percent and (2) the ratio of the (implied) unit values of imports to exports was greater than 1.8 or less than 0.8.

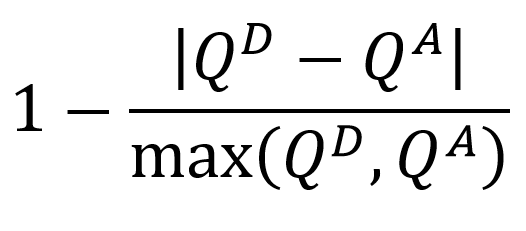
Weighted Trade Gaps:
Discrepancies in the volumes reported for each mirrored trade are then used to weight the raw trade gaps: a higher weight is applied to a given discrepancy in value, the smaller is the associated volume discrepancy. The use of weighted measures (rather than the raw trade gaps) in Comtrade estimates is intended to improve the reliability of the trade misinvoicing estimates. The weighting scheme is described in formal terms as follows: let QD and QA denote, respectively, the reported volume of trade (of a particular good in a particular year) between a developing country reporter (D) and its advanced-country trade partner (A). The weight applied to the value gap in value terms was specified as:
For a more detailed description, please see GFI’s Value Gap Analysis Methodology.
References
Census and Statistics Department of the Government of Hong Kong Special Administrative Region. (n.d.). Entrepôt trade through Hong Kong. Hong Kong, Hong Kong, China. Retrieved 5 2017
Centre d’Études Prospectives et d’Informations Internationales. (n.d.). Geographical Information.
Swiss Customs Administration. (n.d.). Swiss foreign trade in gold, silver and coins by trading partner, 1982-2013. Retrieved 3 2015, from Swiss Customs Administration: https://www.ezv.admin.ch/dam/ezv/en/dokumente/abgaben/Aussenhandelstatistik/Diffusion/Daten/Waren/2_3_Gold_LD.xlsx.download.xlsx/2_3_GOLD_LD_EXPIMP_en.xlsx
United Nations Statistics Division. (n.d.). UN Comtrade Database. Retrieved 2 2019, from UN Comtrade Database: https://comtrade.un.org/
University of Notre Dame, Kellogg Institute For International Studies. (n.d.). NSF-Kellogg Institute Data Base on Economic Integration Agreements. Retrieved from https://kellogg.nd.edu/nsf-kellogg-institute-data-base-economic-integration-agreements
World Bank. (n.d.). Tariff and Trade Analysis. Retrieved from World Integrated Trade Solution: https://wits.worldbank.org/WITS/WITS/Restricted/Login.aspx
Appendix 1: Countries Covered in GFI’s Analysis