
This report examines the latest official government trade data reported to the United Nations to estimate the magnitude of trade misinvoicing – one of the largest components of measurable illicit financial flows (IFFs) between and among 135 developing countries and 36 advanced economies. Trade misinvoicing occurs when importers and exporters deliberately falsify the stated prices on the invoices for goods they are importing or exporting as a way to illicitly transfer value across international borders, evade tax and/or customs duties, launder the proceeds of criminal activity, circumvent currency controls, and hide profits offshore.
It is important to note that while the term “illicit financial flows’’ (IFFs) tends to include many types of activities, such as trade misinvoicing, smuggling, tax evasion, etc., this report only focuses on trade misinvoicing, or the trade-related aspects of illicit financial flows. It does not address all forms of IFFs.
The countries included in this report are based on the International Monetary Fund classification system, which is comprised of 148 developing countries and 36 advanced economies. However, 13 of the developing countries did not report sufficient trade data to the United Nations to be included in this analysis.
In order to identify a country’s imports/exports that may have been misinvoiced, Global Financial Integrity (GFI) conducts a value gap analysis by examining data submitted by governments each year to the United Nations Comtrade database and applying a series of filters to ensure unmatched trades are omitted. GFI then uses a partner-country analysis to compare and contrast the differences between any set of two countries in order to identify value gaps, or mismatches, in the reported data. For example, if Ecuador reported exporting US$20 million in bananas to the United States in 2016, but the US reported having imported only US$15 million in bananas from Ecuador that year, this would reflect a mismatch, or value gap, of US$5 million in the reported trade of this product between the two partners for that year. While the available data is not perfect and country figures are not exact, the resulting value gap estimates are the result of rigorous analysis and provide an order of magnitude view of each country’s trade misinvoicing challenge, reflecting the degrees of trade misinvoicing happening between any two countries.
Key findings include:
US$8.7 trillion: The sum of the value gaps identified in trade between 135 developing countries and 36 advanced economies over the ten-year period 2008-2017;
US$817.6 billion: The sum of the value gaps identified in trade between 135 developing countries and 36 advanced economies1 in 2017, the most recent year for which comprehensive data are available. This analysis adds to what GFI has provided in previous annual reports. (See Table A in the Annex);
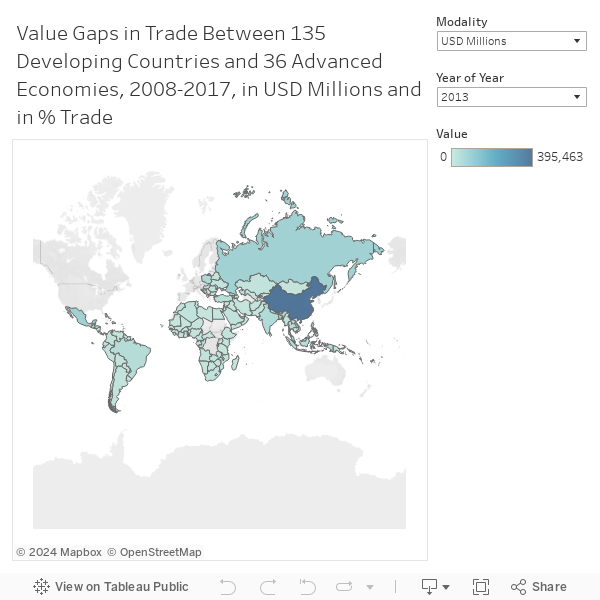
Developing countries with the largest annual average value gaps (in US dollars) in their bilateral trade with 36 advanced economies over the ten-year period 2008-2017 (See Table B in the Annex):
- China – US$323.8 billion
- Mexico – US$62.9 billion
- Russia – US$56.8 billion
- Poland – US$40.9 billion
- Malaysia – US$36.7 billion
Developing countries with the largest value gaps as a percent of their total bilateral trade with the 36 advanced economies over the ten-year period (See Table C in the Annex):
- The Gambia – 37.3 percent
- Togo – 30.2 percent
- The Maldives – 27.4 percent
- Malawi – 26.8 percent
- The Bahamas – 26.6 percent
By contrast, China ranked 80th out of the 135 developing countries analyzed, with an average value gap of 18.8 percent of its total bilateral trade with the 36 advanced economies over the same period.
Developing countries with the largest average value gaps as a percent of total trade between the 135 developing countries and all trading partners over 2008-2017 (See Table F in the Annex):
- The Gambia – 46.8 percent
- Seychelles – 38.3 percent
- Paraguay – 27.1 percent
- Ghana – 26.5 percent
- The Bahamas – 25.9 percent
The three largest value gaps (in US dollars) by harmonized system (HS) chapter between the 135 developing countries and 36 advanced economies over 2008-2017 (See Table D in the Annex):
- Electrical Machinery (HS 85) – US$153.7 billion
- Mineral Fuels (HS 27) – US$113.2 billion
- Machinery (HS 84) – US$111.7 billion
The average sizes of the value gaps by dollar amount between the developing country regions and the 36 advanced economies over the ten-year period of 2008-2017 (See Table 9 on page 27):
- Asia – US$476.3 billion
- Developing Europe – US$167.9 billion
- Western Hemisphere – US$131.5 billion
- Middle East/North Africa – US$70.6 billion
- Sub-Saharan Africa – US$27.2 billion
US$63 billion: The largest value gap identified when examining trade misinvoicing between developing country regions over the ten-year period was between Developing Asia and the Middle East/North Africa in 2014 (See Table 11 on page 29);
US$1 billion: The lowest value gaps identified when examining trade misinvoicing between the developing country regions over the ten-year period were between Sub-Saharan Africa’s trade with Developing Europe, Middle East/North Africa and the Western Hemisphere in several of the years (See Table 11 on page 29);
20 percent: The average sizes of the value gaps as a percentage of total trade within South- South trade and within North-South trade, which suggests that trade misinvoicing is proportionately a similar problem in trade among developing countries as it is in trade between developing countries and advanced economies. (See Table 13 on page 31).
Overall, the analysis shows trade misinvoicing is a persistent problem across developing countries, resulting in potentially massive revenue losses – at a time when most countries are struggling to mobilize domestic resources to achieve the internationally-agreed UN 2030 Sustainable Development Goals (SDGs).
The analysis is intended to help identify the countries most likely at risk for trade misinvoicing (and therefore, significant government revenue losses), and to recommend policy measures to combat trade misinvoicing to customs authorities in-country and those of their major trading partners.
In the final section of this report, GFI provides a list of policy recommendations for governments to consider adopting in order to more effectively address the problem of trade misinvoicing in particular, and the broader problems of IFFs in general.