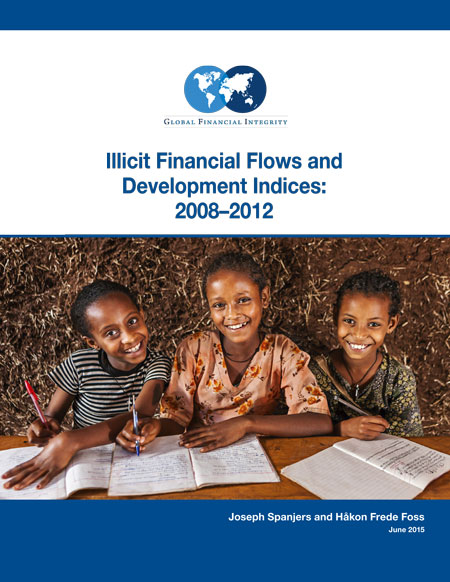
This June 2015 report, the latest in a series by Global Financial Integrity (GFI), highlights the outsized impact that illicit financial flows have on the world’s poorest economies. The study looks at illicit financial flows from some of the world’s poorest nations and compares those values to some traditional indicators of development—including GDP, total trade, foreign direct investment, public expenditures on education and health services, and total tax revenue, among others—over the period 2008–2012.
The report also produces several scatter plots in which illicit flows values for all developing and emerging market nations are compared to key trade indicators and various development indices, such as human development, inequality, and poverty, to determine if correlations exist between the two.
[wptab name=’Overview’]
Overview
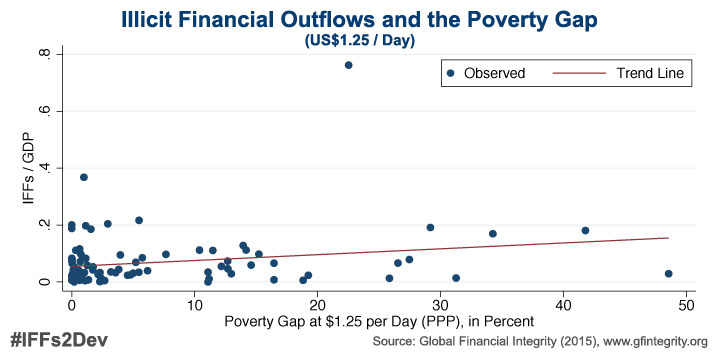
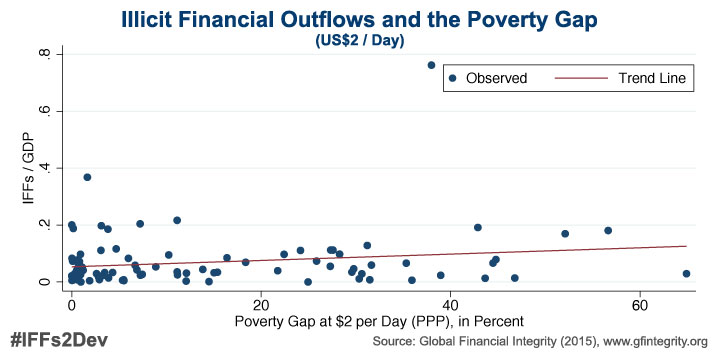
Correlation to Higher Poverty
By two different measures of poverty, the study reveals a positive correlation between higher levels of poverty and larger illicit outflows. That is, countries with higher levels of illicit financial flows (relative to GDP) tend to struggle with higher levels of poverty.
[wptab1 name=’Poverty Gap (US$1.25/Day)’ set=’1′]
[/wptab1]
[wptab1 name=’Poverty Gap (US$2.00/Day)’ set=’1′]
[/wptab1]
[end_wptabset1 set=’1′ skin=”gray” ]
Correlation to Higher Inequality
By two different measures of inequality, the report finds a positive correlation between higher levels of illicit financial outflows and higher income inequality.
[wptab1 name=’Top 10% Income Share’ set=’2′]
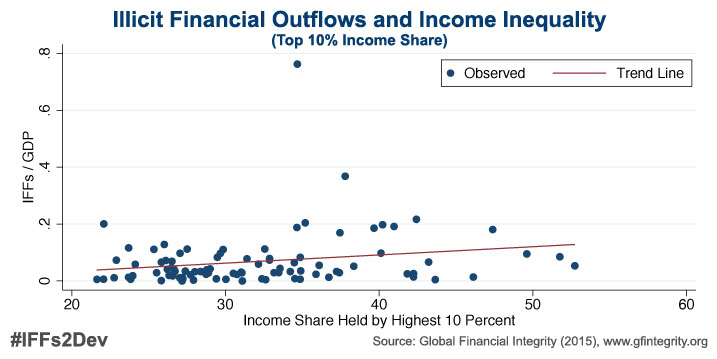
[/wptab1]
[wptab1 name=’Gini Coefficient’ set=’2′]
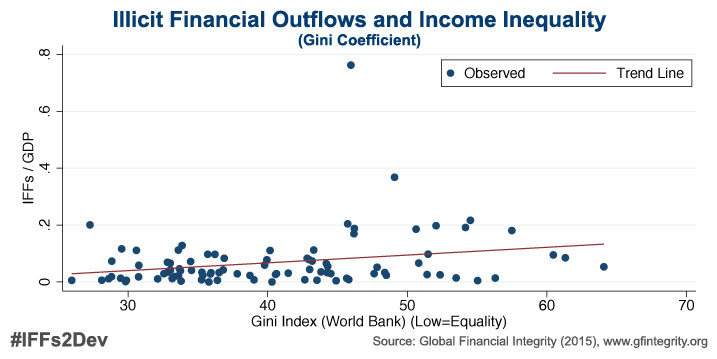
[/wptab1]
[end_wptabset1 set=’2′ skin=”gray” ]
Correlation to Lower Human Development
The study finds that there is a negative correlation between human development and illicit outflows. That is, countries with higher levels of IFFs (relative to GDP) tend to have a lower score on the human development index.

[/wptab]
[wptab name=’Tables’]
Tables
All of the tables from the report can be downloaded in Excel here or they can be viewed interactively below.
Table 1. Illicit Financial Outflows to GDP
| Rank | Country | Ratio |
|---|---|---|
| 1 | Togo | 76.3% |
| 2 | Liberia | 61.6% |
| 3 | Vanuatu | 35.6% |
| 4 | Djibouti | 35.5% |
| 5 | Solomon Islands | 22.2% |
| 6 | Equatorial Guinea | 21.8% |
| 7 | Samoa | 21.8% |
| 8 | Honduras | 21.7% |
| 9 | Nicaragua | 20.4% |
| 10 | Lesotho | 19.2% |
| 11 | Paraguay | 18.6% |
| 12 | Zambia | 18.1% |
| 13 | Guyana | 17.3% |
| 14 | Malawi | 16.9% |
| 15 | Sao Tome and Principe | 12.8% |
| 16 | Comoros | 12.2% |
| 17 | Chad | 11.2% |
| 18 | Ethiopia | 11.2% |
| 19 | Armenia, Republic of | 11.1% |
| 20 | Congo, Republic of | 11.1% |
| 21 | Swaziland | 9.8% |
| 22 | Lao People's Democratic Republic | 9.7% |
| 23 | Gambia, The | 8.8% |
| 24 | Nigeria | 7.9% |
| 25 | Cote d'Ivoire | 7.3% |
Table 2. Illicit Financial Outflows to Total Trade
Rank Country Ratio
1 Togo 105.0%
2 Liberia 80.6%
3 Djibouti 71.3%
4 Vanuatu 67.6%
5 Samoa 45.3%
6 Ethiopia 31.7%
7 Honduras 31.2%
8 Nicaragua 28.9%
9 Comoros 26.1%
10 Solomon Islands 25.6%
11 Malawi 24.6%
12 Zambia 24.1%
13 Syrian Arab Republic 23.7%
14 Paraguay 23.3%
15 Gambia, The 22.5%
16 Armenia, Republic of 21.6%
17 Sao Tome and Principe 21.1%
18 Rwanda 21.1%
19 Chad 20.2%
20 Lao People's Democratic Republic 19.8%
21 Nepal 17.8%
22 Guyana 16.4%
23 Nigeria 16.3%
24 Guinea-Bissau 16.2%
25 Equatorial Guinea 16.1%
Table 3. Illicit Financial Outflows to Population
| Rank | Country | IFFs / Capita | GDP / Capita |
|---|---|---|---|
| 1 | Equatorial Guinea | $3,978.19 | $18,982.29 |
| 2 | Vanuatu | $996.65 | $2,862.42 |
| 3 | Samoa | $670.00 | $3,086.90 |
| 4 | Paraguay | $574.24 | $3,108.22 |
| 5 | Guyana | $495.13 | $2,865.75 |
| 6 | Djibouti | $486.20 | $1,379.45 |
| 7 | Honduras | $442.22 | $2,045.98 |
| 8 | Togo | $401.43 | $527.96 |
| 9 | Armenia, Republic of | $359.21 | $3,252.57 |
| 10 | Congo, Republic of | $323.55 | $2,897.13 |
| 11 | Nicaragua | $317.35 | $1,543.53 |
| 12 | Solomon Islands | $302.61 | $1,371.60 |
| 13 | Swaziland | $280.39 | $2,964.56 |
| 14 | Zambia | $220.92 | $1,213.64 |
| 15 | Liberia | $187.85 | $319.90 |
| 16 | Syrian Arab Republic | $183.21 | . |
| 17 | Lesotho | $180.41 | $993.85 |
| 18 | Sao Tome and Principe | $151.06 | $1,185.37 |
| 19 | Nigeria | $124.60 | $1,925.40 |
| 20 | Cabo Verde | $124.41 | $3,503.40 |
| 21 | El Salvador | $113.85 | $3,452.53 |
| 22 | Papua New Guinea | $110.53 | $1,490.90 |
| 23 | Lao People's Democratic Republic | $104.22 | $1,086.96 |
| 24 | Chad | $102.40 | $912.76 |
| 25 | Comoros | $96.32 | $801.87 |
Table 4. Illicit Financial Outflows to Foreign Direct Investments
| Rank | Country | Ratio |
|---|---|---|
| 1 | Nepal | 18568.1% |
| 2 | Burundi | 12732.6% |
| 3 | Togo | 4122.7% |
| 4 | Samoa | 3044.2% |
| 5 | Paraguay | 2064.4% |
| 6 | Tajikistan | 1819.7% |
| 7 | Cameroon | 1634.9% |
| 8 | Ethiopia | 1354.9% |
| 9 | Malawi | 835.9% |
| 10 | Burkina Faso | 724.3% |
| 11 | Guinea-Bissau | 711.4% |
| 12 | Comoros | 625.9% |
| 13 | Vanuatu | 614.2% |
| 14 | Djibouti | 566.2% |
| 15 | Philippines | 518.7% |
| 16 | Cote d'Ivoire | 471.5% |
| 17 | Honduras | 464.6% |
| 18 | Rwanda | 460.5% |
| 19 | Swaziland | 398.2% |
| 20 | Chad | 371.2% |
| 21 | Liberia | 306.1% |
| 22 | Zambia | 293.3% |
| 23 | Nicaragua | 289.6% |
| 24 | Nigeria | 257.3% |
| 25 | Lao People's Democratic Republic | 242.9% |
Table 5. Illicit Financial Outflows to Official Development Assistance and Foreign Direct Investment
| Rank | Country | Ratio |
|---|---|---|
| 1 | Paraguay | 957.6% |
| 2 | Togo | 513.1% |
| 3 | Philippines | 460.0% |
| 4 | Honduras | 255.1% |
| 5 | Nigeria | 209.4% |
| 6 | Swaziland | 209.3% |
| 7 | Papua New Guinea | 201.1% |
| 8 | India | 199.6% |
| 9 | El Salvador | 190.9% |
| 10 | Indonesia | 184.5% |
| 11 | Djibouti | 179.4% |
| 12 | Vanuatu | 175.5% |
| 13 | Chad | 151.8% |
| 14 | Zambia | 143.5% |
| 15 | Nicaragua | 142.6% |
| 16 | Samoa | 117.7% |
| 17 | Nepal | 116.5% |
| 18 | Armenia, Republic of | 111.8% |
| 19 | Cote d'Ivoire | 109.9% |
| 20 | Guyana | 108.4% |
| 21 | Lesotho | 99.7% |
| 22 | Comoros | 98.1% |
| 23 | Lao People's Democratic Republic | 97.1% |
| 24 | Cameroon | 96.5% |
| 25 | Syrian Arab Republic | 96.2% |
Table 6. Illicit Financial Outflows to Public Spending on Education
(from highest average 2008–2012 [IFFs]/[Education Spending] to lowest)| Rank | Country | Ratio |
|---|---|---|
| 1 | Togo | 2435.9% |
| 2 | Liberia | 1649.3% |
| 3 | Zambia | 1314.3% |
| 4 | Vanuatu | 842.4% |
| 5 | Chad | 555.9% |
| 6 | Guyana | 511.5% |
| 7 | Samoa | 471.6% |
| 8 | Nicaragua | 423.1% |
| 9 | Paraguay | 361.0% |
| 10 | Lao People's Democratic Republic | 359.8% |
| 11 | Armenia, Republic of | 335.9% |
| 12 | Malawi | 315.3% |
| 13 | Solomon Islands | 254.0% |
| 14 | Ethiopia | 245.0% |
| 15 | Congo, Republic of | 235.2% |
| 16 | Gambia, The | 230.4% |
| 17 | Nepal | 228.8% |
| 18 | Cote d'Ivoire | 224.8% |
| 19 | Lesotho | 204.1% |
| 20 | Mali | 177.9% |
| 21 | Sao Tome and Principe | 172.5% |
| 22 | Uganda | 170.9% |
| 23 | Philippines | 170.6% |
| 24 | Guinea | 153.1% |
| 25 | Rwanda | 147.1% |
Table 7. Illicit Financial Outflows to Public Spending on Health
(from highest average 2008–2012 [IFFs]/[Health Spending] to lowest)| Rank | Country | Ratio |
|---|---|---|
| 1 | Togo | 1088.7% |
| 2 | Vanuatu | 931.4% |
| 3 | Congo, Republic of | 483.5% |
| 4 | Equatorial Guinea | 478.1% |
| 5 | Liberia | 455.7% |
| 6 | Djibouti | 417.1% |
| 7 | Samoa | 361.0% |
| 8 | Chad | 329.6% |
| 9 | Solomon Islands | 315.5% |
| 10 | Lao People's Democratic Republic | 304.2% |
| 11 | Comoros | 302.5% |
| 12 | Zambia | 284.0% |
| 13 | Nicaragua | 265.2% |
| 14 | Armenia, Republic of | 264.6% |
| 15 | Guyana | 264.0% |
| 16 | Ethiopia | 259.5% |
| 17 | Honduras | 251.6% |
| 18 | Paraguay | 242.7% |
| 19 | Malawi | 200.1% |
| 20 | Gambia, The | 192.2% |
| 21 | Lesotho | 190.7% |
| 22 | Sao Tome and Principe | 180.3% |
| 23 | Papua New Guinea | 160.5% |
| 24 | Nigeria | 124.4% |
| 25 | Swaziland | 116.7% |
Table 8. Illicit Financial Outflows to Total Tax Revenues
(from highest average 2008–2012 [IFFs]/[Tax] to lowest)| Rank | Country | Ratio |
|---|---|---|
| 1 | Samoa | 98551.8% |
| 2 | Togo | 497.6% |
| 3 | Congo, Republic of | 373.7% |
| 4 | Liberia | 257.4% |
| 5 | Nigeria | 229.4% |
| 6 | Paraguay | 156.7% |
| 7 | Ethiopia | 152.5% |
| 8 | Nicaragua | 147.0% |
| 9 | Honduras | 146.0% |
| 10 | Vanuatu | 142.0% |
| 11 | Equatorial Guinea | 138.7% |
| 12 | Zambia | 124.8% |
| 13 | Sao Tome and Principe | 83.9% |
| 14 | Lao People's Democratic Republic | 73.9% |
| 15 | Armenia, Republic of | 64.0% |
| 16 | Nepal | 56.9% |
| 17 | Cote d'Ivoire | 52.4% |
| 18 | Rwanda | 51.7% |
| 19 | Mali | 46.1% |
| 20 | Lesotho | 45.1% |
| 21 | Uganda | 44.2% |
| 22 | Burkina Faso | 42.9% |
| 23 | India | 39.6% |
| 24 | Indonesia | 37.2% |
| 25 | Gambia, The | 37.0% |
Table 9. Illicit Financial Outflows to Capital Stock
(from highest average 2008–2012 [IFFs]/[Capital Stock] to lowest)| Rank | Country | Ratio |
|---|---|---|
| 1 | Togo | 24.6% |
| 2 | Liberia | 23.4% |
| 3 | Equatorial Guinea | 19.3% |
| 4 | El Salvador | 7.2% |
| 5 | Nigeria | 6.6% |
| 6 | Congo, Republic of | 6.5% |
| 7 | Chad | 6.4% |
| 8 | Honduras | 6.4% |
| 9 | Zambia | 6.0% |
| 10 | Djibouti | 5.7% |
| 11 | Paraguay | 5.3% |
| 12 | Cote d'Ivoire | 4.1% |
| 13 | Mali | 3.6% |
| 14 | Sao Tome and Principe | 3.2% |
| 15 | Sudan | 2.8% |
| 16 | Lesotho | 2.7% |
| 17 | Armenia, Republic of | 2.7% |
| 18 | Ethiopia | 2.5% |
| 19 | Rwanda | 2.3% |
| 20 | Malawi | 2.2% |
| 21 | Gambia, The | 1.8% |
| 22 | Uganda | 1.8% |
| 23 | Comoros | 1.7% |
| 24 | Swaziland | 1.3% |
| 25 | Lao People's Democratic Republic | 1.3% |
[/wptab]
[wptab name=’Policy Recommendations’]
Policy Recommendations
Illicit financial flows from developing countries are facilitated and perpetuated primarily by opacity in the global financial system. This endemic issue is reflected in many well-known ways, such as the existence of tax havens and secrecy jurisdictions, anonymous companies and other legal entities, and innumerable techniques available to launder dirty money—for instance, through misinvoicing trade transactions. This is, essentially, trade fraud and is often referred to as trade-based money laundering when used to move the proceeds of criminal activity.
Curtailing Trade Misinvoicing
Of the estimated US$1 trillion in measurable illicit outflows each year, trade misinvoicing is the method most often used to move funds offshore.1 Close to 80 percent of all outflows use misinvoicing as the preferred method of movement—meaning that curbing trade misinvoicing must be a major focus for policymakers around the world.
This year presents a spectacular opportunity to tackle the scourge of illicit financial flows. The Millennium Development Goals (MDGs) are set to expire in 2015, and, in September, the United Nations will formally transition to its post-2015 development agenda. Known as the Sustainable Development Goals (SDGs), this framework will establish objectives in 17 areas of global development.2 Additionally, in July, the Financing for Development (FfD) process will conclude with a UN conference in Addis Ababa, Ethiopia.3 The FfD process will create a document that is a formal demonstration of political will to address the issues of economic development and global poverty. The FfD and SDG processes will go hand-in-hand to set the global development agenda for the next 15 years.
This is why GFI is calling on the United Nations to adopt, in these documents, a clear and precise prescription to address illicit flows including:
- A declaration that the global community aims to eliminate illicit flows eventually and to reduce them by 50 percent in each developing country by 2030.
- An official definition of IFFs as follows: “illicit financial flows are the cross-border movement of funds that are illegally earned, transferred, and/or utilized.”
- Calling on the IMF to estimate the volume of illicit financial flows for each developing country and then monitor their yearly progress toward a 50 percent reduction by 2030.
- A formal commitment to ensuring that commercially available trade databases, and related training, are made available to developing country customs departments, which will enable them to identify, investigate and interdict goods that have been misinvoiced in order to substantially reduce illicit flows.
Additionally, the following measures should be taken by all states:
Anti-Money Laundering
All countries should, at a minimum, take whatever steps are needed to comply with all of the Financial Action Task Force (FATF) Recommendations to combat money laundering and terrorist financing.4
Regulators and law enforcement officials should strongly enforce all of the anti-money laundering laws and regulations that are already on the books, including through criminal charges and penalties for individuals employed by financial institutions who are culpable for allowing money laundering to occur.
Beneficial Ownership of Legal Entities
All countries and international institutions should address the problems posed by anonymous companies and other legal entities by requiring or supporting meaningful confirmation of beneficial ownership in all banking and securities accounts.
Additionally, information on the true, human owner of all corporations and other legal entities should be disclosed upon formation, updated on a regular basis, and made freely available to the public in central registries. The United Kingdom5 and Denmark6 have made progress on this front recently, with the UK passing legislation to create public registries of beneficial ownership—at least for corporations—and Denmark committing to do likewise. Other countries should follow their lead. In December 2014, as part of revisions to the European Union’s Anti-Money Laundering Directive (AMLD), the EU decided to require member states to create central registries of beneficial ownership, and mandated that the information be provided not only to law enforcement and financial institutions, but also to members of the public with a “legitimate interest” in the information—although there is no indication of what interests will be considered legitimate.7 GFI urges all EU member states to quickly implement the central registry requirement and to go beyond the standard required by the AMLD to ensure that all information collected is made freely available to the public.
Automatic Exchange of Financial Information
All countries should actively participate in the global movement toward the automatic exchange of financial information as endorsed by the G20 and the OECD. 89 countries have committed to implementing the OECD/G20 standard on automatic information exchange by the end of 2018.8 Still, the G20 and the OECD need to do a better job at ensuring that developing countries—especially least developed countries—are able to participate in the process and are provided the necessary technical assistance to benefit from it.
Country-by-Country Reporting
All countries should require multinational corporations to publicly disclose their revenues, profits, losses, sales, taxes paid, subsidiaries, and staff levels on a country-by-country basis, as a means of detecting and deterring abusive tax avoidance practices.
Footnotes
- Kar and Spanjers, Illicit Financial Flows from Developing Countries: 2003–2012, 15.
- Open Working Group on Sustainable Development Goals. Open Working Group Proposal for Sustainable Development Goals. New York: United Nations, July 19, 2014. http://sustainabledevelopment.un.org/sdgsproposal.html.
- Financing for Development Office. Third International Conference on Financing for Development. New York: United Nations. http://www.un.org/esa/ffd/ffd3/.
- Financial Action Task Force. The FATF Recommendations: International Standards on Combating Money Laundering and the Financing of Terrorism & Proliferation. Paris, France: FATF, Feb. 2012. http://www.fatf-gafi.org/topics/fatfrecommendations/documents/fatf-recommendations.html.
- Global Financial Integrity (GFI). Landmark UK Transparency Law Raises Pressure on White House, Congress. Washington, DC: GFI, Mar. 26, 2015. https://gfintegrity.org/press-release/landmark-uk-transparency-law-raises-pressure-on-white-house-congress/.
- Christensen, Johan and Anne Skjerning. “Regeringen vil åbne det nye ejerregister for alle.” Dagbladet Børsen (Copenhagen, Denmark), November 7, 2014. http://borsen.dk/nyheder/avisen/artikel/11/97562/artikel.html.
- European Parliament. Money Laundering: Parliament and Council Negotiators Agree on Central Registers. Brussels, Belgium: The European Parliament, Dec. 17, 2014. http://www.europarl.europa.eu/news/en/news-room/content/20141216IPR02043/html/Money-laundering-Parliament-and-Council-negotiators-agree-on-central-registers.
- Global Financial Integrity (GFI). GFI Notes Significant Progress on Automatic Information Exchange but Warns that Poorest Countries Are Being Shunned. Washington, DC: GFI, Oct. 30, 2014. https://gfintegrity.org/press-release/gfi-notes-significant-progress-automatic-information-exchange-warns-poorest-countries-shunned/.
[/wptab]
[wptab name=’Read Report’]
Read the Report
 In addition to downloading the full PDF of the study, the full report can be read, shared, and embedded via the Scribd window below.
[wptab1 name=’English’ set=’1′]
[/wptab]
[end_wptabset1 set=’1′]
[/wptab]
[wptab name=’About’]
About
Global Financial Integrity
Founded in 2006, Global Financial Integrity (GFI) is a non-profit, Washington, DC-based research and advisory organization, which produces high-caliber analyses of illicit financial flows, advises developing country governments on effective policy solutions, and promotes pragmatic transparency measures in the international financial system as a means to global development and security.
Authors
Joseph Spanjers is a Junior Economist at Global Financial Integrity. Prior to joining GFI, Joseph conducted international trade research in Minneapolis and supervised a State Department scholarship program in Morocco. Joseph received a BS in Economics and a BA in Global Studies from the University of Minnesota.
Håkon Frede Foss is an Economics Fellow at Global Financial Integrity. He holds a master’s degree in Economics and Business Administration from the Norwegian School of Economics, as well as bachelor’s degrees from the University of Oslo and the Norwegian School of Economics. He has worked as a financial journalist for Dagens Næringsliv, the Norwegian business daily.
Acknowledgements
The authors wish to thank and acknowledge Raymond Baker (President), Tom Cardamone (Managing Director), Christine Clough (Program Manager), Clark Gascoigne (Communications Director), Rasmus Hansen (Policy Intern), Dev Kar (Chief Economist), Mikael Bélanger Karan (Policy Intern), Uyen Le (Economics Intern), Yuchen Ma (Economics Intern), and Channing May (Policy Associate) for their contributions to the production of this report.
GFI and the authors would also like to acknowledge Gil Leigh of Modern Media for his contributions to the layout and design of the publication.
Funding
Funding for this report was generously provided by the Government of Finland.
[/wptab]

