
GFI Database Helps Countries Boost Domestic Resource Mobilization
By Joseph Spanjers, November 9, 2016
Today, GFI is pleased to announce the launch of GFTrade, a proprietary trade risk assessment application that enables customs officials to determine if goods are priced outside typical ranges for comparable products. A cloud-based system developed over the past year, GFTrade provides officials with real-time price analyses for goods in the port using price ranges for the same product based on global trade information. This information can help to determine if further investigation into potential misinvoicing is warranted, and it has the potential to substantially increase domestic revenue mobilization.
Trade misinvoicing occurs in all countries and for various reasons including to evade tax and/or customs duties, to launder the proceeds of crime, to circumvent currency controls, and to hide profits offshore, among others. In developed nations the ramifications of trade-based money laundering—including its possible connection to terrorist financing—is significant. In developing and emerging market countries, trade misinvoicing can drastically undermine domestic resource mobilization efforts, which weakens a government’s ability to build the economy and alleviate poverty. Indeed, the most recent estimate is that approximately $875 billion in trade misinvoicing occurred in 2013 alone. Additionally, given that rates of tax collection in poorer countries tend to be well below those seen in wealthier countries, the loss of revenue due to trade misinvoicing has a corrosive impact on development.
GFTrade can be utilized by customs offices or other departments that experience financial loss due to trade misinvoicing and are motivated either by a desire to collect correct taxes and tariffs or to prevent trade-based money laundering. Officials at ports or at points of inspection, scanning, documentation, or tariff collection are logical government end-users. Additional government users include finance or justice ministries, which could use the comparative trade data for price prediction and reporting or prosecution purposes. Further, the database can be utilized by banks providing trade financing, by insurance firms providing coverage to shipping firms, and by other users who need accurate trade pricing.
The two screenshots below provide an example of how the system works. In this hypothetical case, a customs official in South Africa can compare the price of a new shipment of motorcycles being imported from the United States against a range of recent pricing for the same product on the same trade route. After searching for the good by its description or Harmonized System (HS) code, the official can view pricing for shipments of motorcycles from the United States to South Africa:
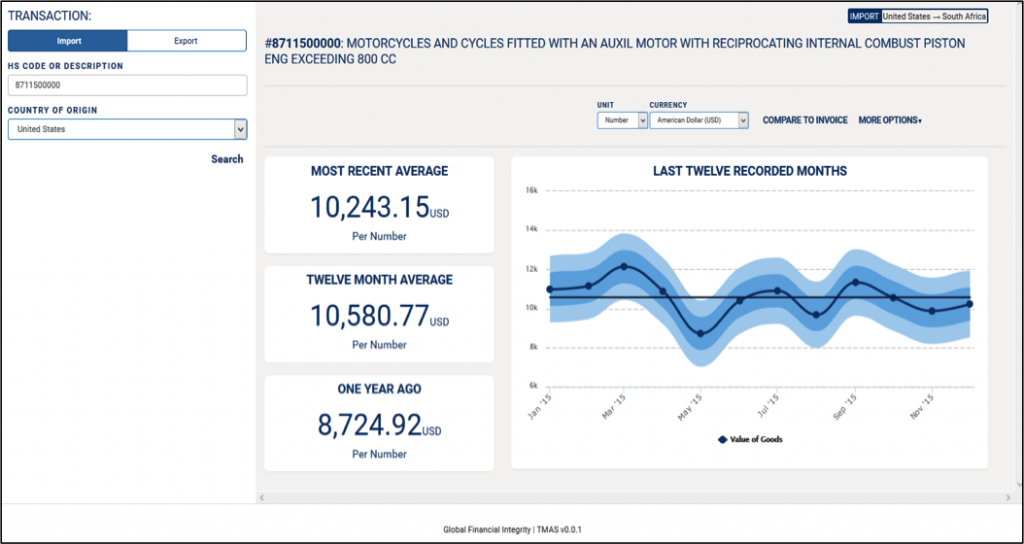
Figure 1: Average pricing data visualization
The data represented on this screen establishes the basis for comparison with the price found on a live invoice. Next, an end user will input the total value of the shipment he/she is processing, and GFTrade will return a visual comparison of the unit price of that shipment with the average price for the previous 12 months. For the purposes of this hypothetical example we have input a unit price of $18,000 per unit. This is visualized as follows:

Figure 2: Price comparison visualization
The figure above provides four ways to determine if a product in the port is priced within a typical range. The first (①) way to make a determination is seen at the top of the screen where the yellow diamond indicating “this invoice” is compared to current average pricing. The greater the distance of this diamond from the “average cost” diamond, the greater the degree of under- or over-pricing. The second way (②) to make this determination is seen to the left of the screen under the heading “Difference With Most Recent Average.” The third (③) way to indicate invoice pricing variations from the norm is represented by a solid yellow horizontal line, which compares the price on the invoice to the visualization initially generated in Figure 1. The final (④) indicator notes whether an invoice is within either one or two standard deviations of recent prices. This allows the user to take recent variations of the price into account in determining the risk of misinvoicing.
The backbone of the system is trade data from 30 of the world’s largest trading countries and the ability to search for goods values based on 80,000 Harmonized System codes. This data is updated automatically on a monthly basis, with only a two-to-three month time lag in data availability. GFI has designed GFTrade to be a flexible, expanding, international system. We intend to integrate additional trade data from a greater number of countries as it becomes available to us, which will further enhance the power of this tool.
GFTrade is an essential tool to assist governments in maximizing domestic resource mobilization. With the system already being rolled out in its first country, and conversations ongoing with many others, GFI is confident that this tool will substantially decrease instances of misinvoicing in the trade of goods. Each new country that implements the system stands to both gain public revenues and retain private capital.